1 Introduction
The 9/11 terrorist attack on the New York World Trade Center (WTC) towers caused
an unprecedented tragedy in the history of architecture. The twin towers WTC 1 and 2 stood in flames caused by jet fuel until
finally, both collapsed totally to the ground with thousands of people
trapped in the buildings. Both towers collapsed at an unnaturally high
speed, which was observed to be nearly equal to that of free fall. Official
statements have already been released by the Federal Emergency Management
Agency (FEMA) in 2002 [1], and also by the National Institute of Standards
and Technology (NIST) in 2005 [2], regarding the incident. FEMA [1] concluded
that the heat of burning jet fuel induced additional stresses into the damaged structural
frames while simultaneously softening and weakening these frames, and this
additional loading and the resulting damage were sufficient to induce the
collapse of both structures. Many detailed numerical analyses were carried
out in [2], and the report was concluded by stating “the WTC towers likely
would not have collapsed under the combined effects of aircraft impact
damage and the extensive, multifloor fires, if the thermal insulation had
not been widely dislodged or had been only minimally dislodged by aircraft
impact.” However, did the fire really spread to such a wide range in the
buildings to cause the total collapse? Moreover, was the heat high enough
to reduce the strengths of structural members? What really caused the free-fall
total collapse? Many questions still remain unresolved. Also, it is to
be noted that although many detailed analyses were performed in [2], not
even a single result can be found showing the dynamic behaviors of the
towers during aircraft impact (Fig. 1). It is clear that the towers experienced
an extreme dynamic load that no other high-rise building has ever experienced
in history. Therefore, we performed
some aircraft impact analyses of a full-model WTC tower, to determine the possibility
of the impact itself acting as a fatal cause of the collapse.

Figure 1. Aircraft impact on WTC 2 [2].
The numerical code used in the
analyses is based on the ASI-Gauss technique [3], which was developed and modified
by Isobe et al., from the adaptively shifted integration (ASI) technique
[4] for the linear Timoshenko beam element. It enables the computation of
highly accurate elastoplastic solutions even with the minimum number of
elements per member. In this paper, we first describe an outline of the
technique and the modeling of the WTC tower, followed by some numerical results
on WTC 2, for which some observed data are available and easy to verify.
2 Numerical Code
2.1 ASI-Gauss Technique
Toi and
Isobe developed the ASI technique [4-6] for the linear Timoshenko beam and
Bernoulli-Euler beam elements, which can easily be incorporated into existing
finite element codes. In this technique, the numerical integration point is
shifted immediately after the occurrence of a fully plastic section in the
element so that a plastic hinge is formed exactly at that section. As a result,
the ASI technique gives more precise elastoplastic solutions than the
conventional schemes, and enables us to simulate dynamic behaviors with strong
nonlinearities using only a small number of elements for a member.

Figure 2. Linear Timoshenko beam element and its physical equivalent.
Figure 2 shows a linear Timoshenko beam element and its physical equivalence
to the rigid bodies-spring model (RBSM). As shown in the figure, the relationship
between the locations of the numerical integration point and the stress
evaluation point where a plastic hinge is actually formed is expressed
as [7]
![]() .
(1)
.
(1)
In the above equation, s is the location of the numerical integration point
and r is the location where stresses and strains are actually evaluated. s is a
nondimensional quantity, which takes a value between -1 and 1.
In both the ASI and ASI-Gauss techniques, the numerical integration point is shifted adaptively when a fully plastic section is formed within an element to form a plastic hinge exactly at that section. When the plastic hinge is determined to be unloaded, the corresponding numerical integration point is shifted back to its normal position. Here, the normal position means the location where the numerical integration point is placed when the element acts elastically. By doing so, the plastic behavior of the element is simulated appropriately, and the converged solution is obtained with only a small number of elements per member. However, in the ASI technique, the numerical integration point is placed at the midpoint of the linear Timoshenko beam element, which is considered to be optimal for one-point integration, when the entire region of the element behaves elastically. When the number of elements per member is very small, solutions in the elastic range are not accurate since one-point integration is used to evaluate the low-order displacement function of the beam element.
The main difference between the ASI and ASI-Gauss
techniques lies in the normal position of the numerical integration point. In
the ASI-Gauss technique, two consecutive elements forming a member are
considered as a subset, and the numerical integration points of an elastically
deformed member are placed such that the stress evaluation points coincide with
the Gaussian integration points of the member. This means that stresses and
strains are evaluated at the Gaussian integration points of elastically
deformed members. Gaussian integration points are optimal for two-point
integration and the accuracy of bending deformation is mathematically
guaranteed [8]. In this way, the ASI-Gauss technique takes advantage of
two-point integration while using one-point integration in actual calculations.

Figure 3. Locations of numerical integration and stress evaluation points in elastic range.
Figure 3 shows the locations of the numerical integrations points of elastically
deformed elements in the ASI and ASI-Gauss techniques. The elemental stiffness
matrix, generalized strain and resultant force increment vectors for the
ASI technique are given by Eqs. (2a)-(2c) and those for the ASI-Gauss technique
by Eqs. (3a)-(3c).
![]() (2a)
(2a)
![]() (2b)
(2b)
![]() (2c)
(2c)
![]() (3a)
(3a)
![]() (3b)
(3b)
![]() (3c)
(3c)
Here, ![]() ,
, ![]() and
and ![]() are the generalized strain increment vector, generalized stress (resultant
force) increment vector and nodal displacement increment vector, respectively.
sg and rg are the locations of the numerical integration and stress evaluation points
for the ASI-Gauss technique in the elastic range. They take values as shown
in Fig. 2. [B] is the generalized strain-nodal displacement matrix, [D]
is the stress-strain matrix and L is the length of the element.
are the generalized strain increment vector, generalized stress (resultant
force) increment vector and nodal displacement increment vector, respectively.
sg and rg are the locations of the numerical integration and stress evaluation points
for the ASI-Gauss technique in the elastic range. They take values as shown
in Fig. 2. [B] is the generalized strain-nodal displacement matrix, [D]
is the stress-strain matrix and L is the length of the element.
The plastic potential used in this study is expressed
by
![]() . (4)
. (4)
Here, fy is the yield function, and Mx , My, N and Mz are the bending moments around the x- and y-axes, axial force and torsional moment, respectively. Those with the subscript 0 are values that result in a fully plastic section in an element when they act on a cross section independently. The effect of shear force is neglected in the yield function.
2.2 Member Fracture and Contact
Algorithm
Structurally
discontinuous problems have also become easily handled in the ASI and ASI-Gauss
techniques, by shifting the numerical integration point of the linear
Timoshenko beam element to an appropriate position, and by releasing the
resultant forces in the element simultaneously [3,6]. Elemental contact is
considered in the code by introducing gap elements between two elements
determined to be in contact by geometrical relations. More details on the code
can be found in [3-6].
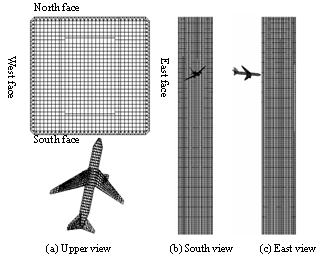
Figure 4. Analyzed model.
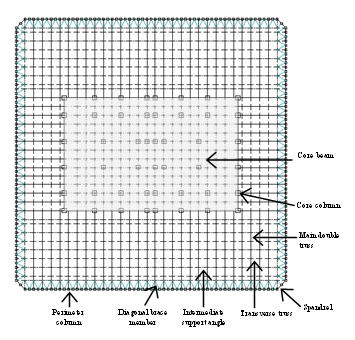
Figure 5. Cross section of the WTC towers.
3
Numerical
Model and Analytical Conditions
3.1 Numerical Model
A full model of the WTC tower is constructed to investigate the overall effect of aircraft impact on the building. Details on the structural members and construction data are extracted and adopted from the reports [1,2]. The tower and the B767-200ER aircraft are both modeled with linear Timoshenko beam elements, of which all members are subdivided into two elements. Figure 4 shows a schematic view of the WTC 2 tower model and the aircraft model. The tower model contains 604,780 elements, 435,117 nodes and 2,608,686 degrees of freedom, while the aircraft model contains 4,322 elements, 2,970 nodes and 17,820 degrees of freedom. Figure 5 shows a cross-sectional view of the towers. A floor is roughly divided into two sections, external and core structures, each with different roles from the structural point of view. The external structure is mainly designed to sustain wind loads, while the main double trusses connected to the core structure support all the floor loads. The whole tower is subjected to a designed dead load of 2,890 MN and 40 % of the allowed capacity load, 300 MN. The ratio of the loads between the core and external structures is adjusted to become approximately 6:4 [1].
All structural members of the B767-200ER aircraft are assumed to have box-shaped cross sections and the material properties of extra super duralumin. The total mass of the aircraft at the time of impact is 142.5 t, which is the sum of the masses of the aircraft (112.5 t) and the jet fuel (30 t) [1]. The mass of each engine is assumed to be 19.315 t. The nose of the aircraft
is tilted 11.5 degrees to the east and 5 degrees downward, and its left wing is
inclined downward by 35 degrees. It is assumed to collide with the 81st floor, south face of WTC 2 with a cruise speed of 590 mph (262 m/s).
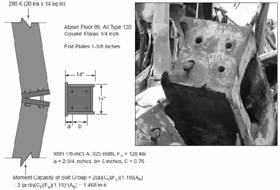
Figure 6. Typical column joint of WTC towers [1].
3.2 Analytical Conditions
Most of the column joints were connected with 34-mm-thick end plates attached by 4 to 6 bolts (Fig. 6). The joints were weak against flexural and shear forces; the simple moment capacity of the bolt group was 20 to 30 % of the plastic moment capacity of the column itself [1]. The beam joints of main double trusses also had simple connections to sustain static, vertical dead loads, which satisfied the initial structural design. The structural design of member joints in Japan, for example, demands the capacity to be greater than that of the member itself. In the present study, the vulnerability of member joints are considered by introducing fracture conditions as follows [3]:
![]() ,
(5)
,
(5)
where ![]() ,
, ![]() ,
, ![]() ,
, ![]() ,
, ![]() and
and ![]() are the bending
strains around the x- and y-axes, the axial tensile strain and the critical values for these three strains, respectively. We
fixed the critical axial tensile
strain
values by comparing the impact damage and motion of the
engines with the observed data. We still need to discuss
critical bending strains in the future, since member joint characteristics are currently
not well known.
are the bending
strains around the x- and y-axes, the axial tensile strain and the critical values for these three strains, respectively. We
fixed the critical axial tensile
strain
values by comparing the impact damage and motion of the
engines with the observed data. We still need to discuss
critical bending strains in the future, since member joint characteristics are currently
not well known.
We also considered the strain
rate effect on yield strength using the Cowper-Symonds equation [9]. An implicit scheme with a consistent mass matrix is adopted in this study. No
damping except for the algorithmic one is applied. ![]() is set to 5/6 and
is set to 5/6 and ![]() to 4/9 in Newmark’s
to 4/9 in Newmark’s ![]() method. The time increment
method. The time increment ![]() t is set to 0.2 ms. An updated Lagrangian formulation is used since large deformations are
expected in the analysis, and the conjugate gradient (CG) method is used as the
solver to reduce the memory requirement. The analytical
code is run on a high-performance computer (1.4
GHz Itanium*2, 8GB RAM), and the
calculation takes approximately two months for a physical
time of 0.7 s.
t is set to 0.2 ms. An updated Lagrangian formulation is used since large deformations are
expected in the analysis, and the conjugate gradient (CG) method is used as the
solver to reduce the memory requirement. The analytical
code is run on a high-performance computer (1.4
GHz Itanium*2, 8GB RAM), and the
calculation takes approximately two months for a physical
time of 0.7 s.


(a)
0.12 s, (b) 0.28 s and (c) 0.56 s after impact
Figure 7. Aircraft impact analysis of WTC 2 (global view).


(a)
0.12 s, (b) 0.28 s and (c) 0.56 s after impact
Figure 8. Motion of fuselage and engines (upper view).
4 Aircraft
Impact Analysis of WTC 2
The numerical results are shown in Figs. 7 and 8. Movie files movie 1 movie 2 can be downloaded at the website [10] . The left engine reduces its speed
rapidly as it directly enters the core structure. The right engine, on
the other hand, glances off the core structure and goes out of the north-east
corner of the tower. Table 1 shows the impact timeline of the fuselage
and both engines. The velocity curve of the right engine is shown in Fig.
9 and a comparison of the damaged surfaces between the numerical result
and the observed data [2] is shown in Fig. 10. Both results are in good
agreement with the observed data.
Table 1: Impact timeline of the B767-200ER aircraft
|
|
|
B767-200ER aircraft |
||
|
Phase |
Elapsed time (s) |
Left engine |
Right engine |
Snout |
|
|
0 |
Snout hits outer-perimeter wall |
||
|
A |
0.048 |
|
|
Hits core structure |
|
|
0.072 |
Hits outer-perimeter wall |
|
|
|
B |
0.076 |
|
Hits outer-perimeter wall |
|
|
C |
0.128 |
Hits core structure |
|
|
|
D |
0.168 |
Hits core column No.902 |
|
|
|
E |
0.504 |
Hits core column No.903 |
|
|
|
F |
0.512 |
|
Hits east side outer-perimeter wall |
|

Figure 9. Velocity curve of the right engine.

(a) Numerical result (b) Observed data [2]
Figure 10. Damage of the WTC 2 south face.
The dynamic transition of the resultant forces during impact is investigated.
Figure 11 shows the transition of axial forces in two typical core columns,
at the site of every ten stories from the ground floor to the top floor.
Core columns are compressed constantly until the snout reaches the core
structure (Phase A in the figures), after which a wave due to impact and
member fracture propagates in horizontal and vertical directions. In particular,
the compression decreases instantly in the fractured core column (No. 1001)
at the floors above the impact point. At the lower levels, compression
changes to tension immediately after the left engine hits the core structure
(Phase C), and continue to vibrate with large amplitude. Note that the
lower the level goes, the larger the amplitude becomes. The core column
(No.1001) at the 60th floor, for example, is heaved for 25 cm in 0.2 s
as a result of this dynamic transition.

Figure 11. Time histories of axial forces in core columns No.508 and No.1001.

Figure 12. Distribution of fractured main double trusses.
What actually caused this dynamic unloading large enough to generate such
large tensile forces? We extracted the time history of the distribution
of fractured main double trusses, as shown in Fig. 12, to investigate the
cause. The propagation of fractured trusses from the impact point to upper
and lower levels can be observed in the figure. This propagation speed
almost matched the longitudinal wave speed in the columns. It can be assumed
that the shock wave due to impact propagated through the tower and occasionally
reflected to other columns at the ground or top levels, destroying each
member joint as it moved on. Our assumed scenario is as follows; the aircraft
impact destroyed several main double trusses, that supported the floor
slabs, and led to a middle-class unloading of core columns. The deformation
due to the unloading caused other trusses to disconnect, which released
further burden from the core columns. This disconnect-and-release process
advanced rapidly in a chain reaction manner and a spring-back phenomenon
might have occurred in many columns in such a way that a compressed spring
is released in a very short moment. It was fatal enough to produce a gigantic tensile force on
the columns, which might have triggered the total fracture of some column joints,
eventually leading to the total collapse of the towers. It can be assumed that
the damage in lower levels was larger, since the lower the level went, the larger
the tensile force became.
5 Conclusion
The assumptions of member joint strength given in this work may not be
sufficient for making any clear statements. However, there is a possibility
that the spring-back phenomenon due to rapid unloading caused by aircraft
impact acted as a fatal cause of the total collapse of the WTC towers.
Further numerical investigations performed by explicitly modeling the behaviors
of member joints, and also for the case of WTC 1 are in progress.
6 Acknowledgements
This work was partially supported by a Grant-in-Aid
for Scientific Research (No.#16206055),
Japan Society for the Promotion of Science. The author also would like to thank Zion Sasaki and Kyaw Myo Lynn, former
graduate students of his lab, for contributing greatly to this work.